Dashboards: An Exponential Organization’s Best Business Advisor

Can you imagine driving a car that’s missing a dashboard?
You won’t know in real-time how fast you are going, how much fuel you have left in the tank, and you’ll never see a light warning you to check the engine. It’s not much different than driving blind.
Just as a car dashboard provides real-time information of your car’s performance and health, a business dashboard provides fast feedback, which makes massive growth possible by revealing opportunities and threats in real time. By always having a real-time “snapshot” of team performance and company health, businesses can ensure efficiency, productivity, profitability, and growth while minimizing costs and mistakes.
In this article, I’ll dive more into what business dashboards are, how Exponential Organizations (ExOs) are using it to get a competitive edge, and how you can leverage dashboards to improve company efficiency, productivity, profitability and growth.
The Main Components Of A Dashboard For Business
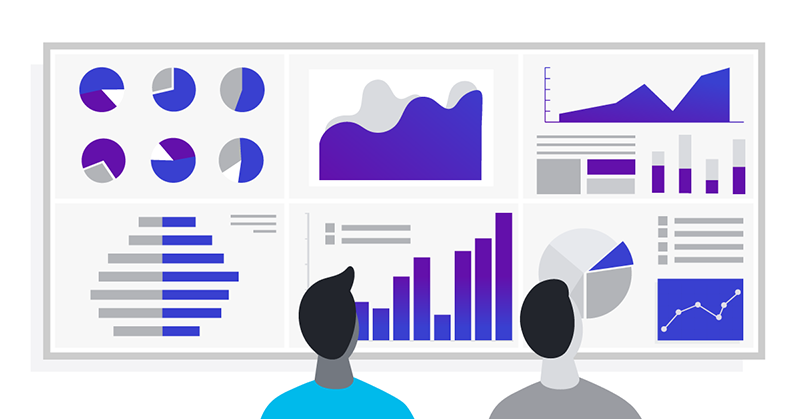
Dashboards, also known as “progress report” or “report”, is essentially an at-a-glance information management tool which displays all essential company and employee metrics, and is accessible to everyone in the organization.
The dashboard of an ExO is made up of two basic components: external information and internal information. External information will display key metrics of external performance such as conversion rates, subscription drop offs, sales, and inventory. Internal information on the other hand tracks information such as employee or department performance and other qualitative indicators related to the progress of achieving the company’s core business objectives and goals.

Classifications of Dashboards
In general, dashboards with external information and internal information can be classified into three different roles: strategic, analytical, and operational.
Strategic dashboards provide a quick overview of the health and opportunities of the business. These dashboards typically focus on high level measures of performance and forecasts over set time frames, such as monthly, quarterly or yearly. Support managers and decision makers use strategic dashboards to identify and correct negative trends, as well as make informed decisions based on collected business intelligence to align strategies and organizational goals.
Analytical dashboards typically drill down deeper into low level data which often include more context on performance evaluators. By tracking large volumes of data, these dashboards help managers investigate trends, predict outcomes and discover insights to help organizations reach and establish targets.
Lastly, operational dashboards are more focused on monitoring information, activities and events which are constantly changing and might require immediate attention. An example of this is monitoring the temperature of a boiler at a factory to avoid explosions. Operational dashboards may also be applied to increase efficiency and productivity across various departments of an organization, such as human resources, recruiting, sales, operations, security, information technology, project management, and customer relationship management.
How Real-Time Dashboards Helped ExOs Crush The Competition
When you have all the essential strategic, analytical, and operational data available in real time, the effect is really powerful.
Every person in your organization can see what’s going on and what needs immediate attention or adjustments. Dashboards also become critical when it comes to making decisions during top-level meetings and daily huddles, so your organization can optimize performance and resolve problems before they steamroll into something bigger.
A good example of how real-time dashboards have helped ExOs perform better and get ahead of their competition is Walmart.
In the early 1990s, giant retailers such as Sears and Kmart would calculate their daily transactions store by store. A regional hub then tallies results for multiple stores. Then a buyer at the head office would analyze the total of all regional hubs to determine how many boxes of Pampers the company needs to order for its next bulk purchase.
The whole process would take weeks.
Walmart blew this model apart and revolutionized retailing by launching its own geostationary satellite and then tracking inventory and supply chain transfers in real time; which allowed them to track inventory at any store, instantly.
With real-time business information at their fingertips, Walmart could make important decisions quickly and crushed the competition by consistently outperforming other chains by 15 percent — a staggering competitive margin in retail.
Technology And Internet Has Made It Easier For Any Organization To Implement Dashboards
The truth is, with the online infrastructure available today, you don’t need to launch your own satellite like Walmart did just to get into the game. Creating an effective, real-time dashboard is a lot simpler than it was even just a few years ago.
Many of today’s startups (as well as more mature enterprises) are leveraging wireless broadband, the internet, sensors, and the cloud to easily collect data and track essential data in real time.
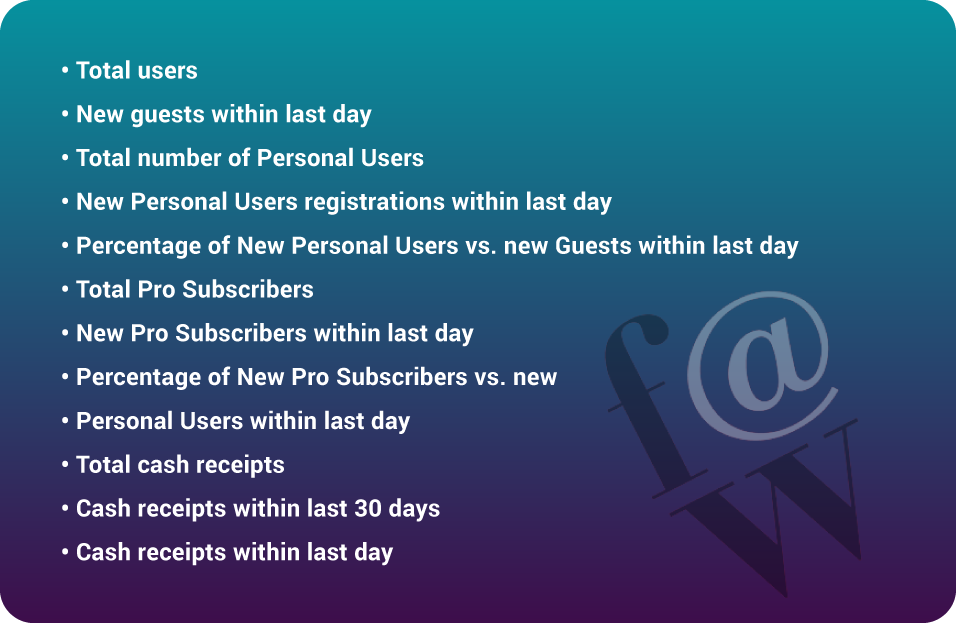
For example, Will Henshall, founder and CEO of the fascinating startup Focus@Will, which streams anti-distraction music and sounds to help users focus, uses the internet and technology to track the following metrics for his business in real-time:

To a corporate executive from just twenty years ago this would be an astounding list of measurements — almost beyond imagination. But the quality of this list is even more impressive than its quantity. It offers metrics about customer behavior every bit the equal of information stored in the head of an old-time storekeeper about the needs and wants of each of his small-town patrons — but on a global scale.
Another example is Zendrive, who uses dashboards to keep track of overall fleet safety, including best and worst drivers, how new drivers rank, impact of feedback on drivers, and trip level detail.
Leveraging Outsourcing With Dashboards
Thanks to technology, it’s also become easier than ever for organizations to hire staff-on-demand so they can remain lean and agile in today’s rapidly changing business environment.
However, working with a global team of talent can be challenging to manage, especially with timezone differences making it very difficult to have regular meetings to report progress.
By using project dashboards to manage the tasks you outsource, everyone on the team can see the real-time progress of projects, communicate and provide feedback with ease, and save valuable time.
Dashboards can also be combined with readily-available outsourcing platforms such as GigWalk.
Let’s say for example you own 50 McDonald’s and you want to ensure each franchise meets the cleanliness and sanitary standards for customer satisfaction. It’s too expensive to install and monitor CCTVs at all your franchises just to monitor the cleanliness of each McDonald’s franchise you own.
In the past, you would have no idea what’s going on in each franchise in real-time. Today with GigWalk, you can essentially pay anyone with a smartphone $5 to walk into their local McDonald’s and take a picture of the bathroom, giving you incredible data about the business in real time.
Now, it’s entirely possible to monitor the cleanliness of all 50 franchises daily for a small investment of just a few thousand. In the past that was either not possible at all, or it would cost millions of dollars to do.
By combining dashboards with staff-on-demand and outsourcing platforms, you can streamline your strategic, analytical, and operational decisions.
Using Dashboards To Measure Real Value KPIs And OKRs
One thing ExOs are doing differently with dashboards is using it to gather and analyze data in an entirely different way to achieve better productivity, employee morale, and innovations.
Traditionally, company performance was measured by vanity metrics known as Key Performance Indicators (KPIs). These include statistics such as number of visitors or mobile app downloads.
ExOs are going beyond this and are tracking real value metrics as well, such as repeat usage, retention percentage, monetization, and Net Promoter Score (NPS). This emergent focus on real value KPIs is also being built into how ExOs execute and measure the results of experimentation to accelerate their learning and get ahead of the competition.
Additionally, KPIs typically only recognize achievement when the goal is met. This can mean a long delay between accomplishment and recognition for individual employees and teams. Often, this leads to negativity experienced around performance reviews of employees and teams based on KPIs, which can be extremely demotivating for top employees and high achievers.
To respond to this, ExOs are also now adopting tracking Objectives and Key Results (OKR). Invented at Intel by CEO Andy Grove and brought to Google by venture capitalist John Doerr in 1999, OKR tracks individual, team, and company goals and outcomes in an open and transparent way.
In “High Output Management”, Grove’s highly regarded manual, he introduced OKRs as the answer to two simple questions:
- Where do I want to go? (Objectives)
- How will I know I’m getting there? (Key Results to ensure progress is made)
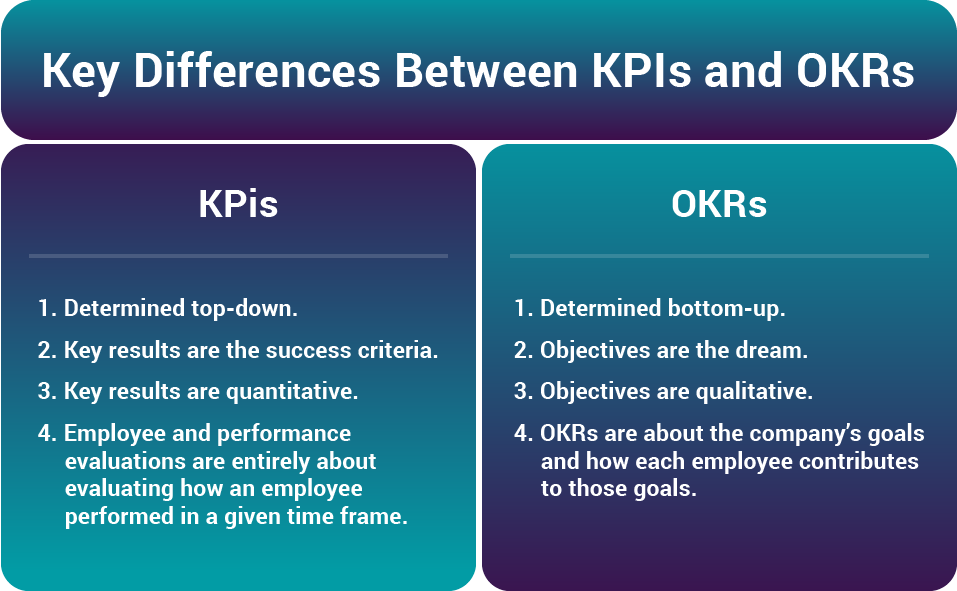
Here are the key differences between KPIs and OKRs.

Dashboards of value metrics and KPIs, used in conjunction with OKRs, are becoming the de facto standard for measuring ExOs — everything from the company as a whole to individual teams and employees. At Google, for example, all OKRs are completely transparent and public within the company.
Furthermore, younger-generation employees have experienced different conditioning in terms of measurements and feedback loops than have older generations. For example, embedded within the highly popular game of World of Warcraft are dashboards similar to OKRs and Lean metrics with short feedback cycles. Having a dashboard similar to what they’re accustomed to can drive motivation and productivity.
The Critical Reason Why You Need Dashboards
So what's the ultimate point of the dashboard?
It’s about fast feedback. When opportunities and threats could be revealed in real time, massive growth becomes possible.
Dashboards also allow you to catch internal problems before they grow into big mistakes. By keeping track of your overall business health and individual and team assessments in real time, you have a better chance of catching negative trends or problems so you can nip it in the bud, essentially saving your company from costly mistakes.
Finally, another key advantage of dashboards, which you can’t afford to miss out on, is it saves time compared to running multiple reports. Dashboards do all the ‘heavy work’ of reporting real-time data compiled automatically from various sources, saving your employees from the large amount of time needed to dive into multiple spreadsheets and databases to produce manual reports, monitor operations, and make key strategy decisions.
For a practical way to learn how to apply this tool into your current business while getting mentorship, peer-to-peer feedback, and customized support as you implement, check out my Exponential Organization Master Business Course here.


-1.jpg)